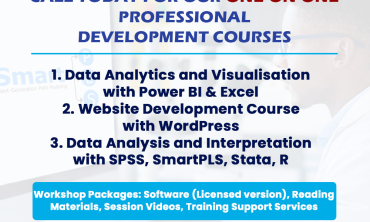
Course Description: This workshop training is designed for individuals who want to acquire essential skills in data visualization and business intelligence using Microsoft Excel. Participants will learn how to import, transform, clean, analyze, and visualize data to make informed business decisions.
Course Duration: 2 weeks
Prerequisites:
- Basic computer skills
- Familiarity with Microsoft Office applications
- Has Zoom video conferencing tool
- Willing to learn business analytics
Course Objectives
At the end of the workshop training, participants will be able to:
- Write formulas in Excel.
- Transform and clean data to create a data model.
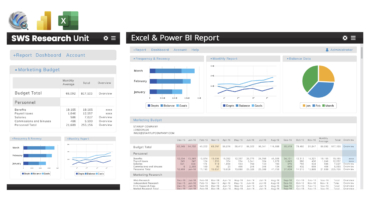
- Create tables, charts, or graphs (pivots) that provide visual representations of the data.
- Create reports that are collections of visuals on one or more Excel sheets.
- Share reports with others.
Course Outline:
Session 1: Introduction to Excel for Data Analytics
- Understanding the role of Excel in data analysis
- Exploring Excel’s interface and key functionalities for data analysis
- Importing and organizing data in Excel
- Cleaning and preparing data for analysis
- Applying data formatting techniques for improved analysis
Session 2: Excel Formulas and Functions for Data Analysis
- Understanding Excel formulas and cell references
- Performing basic calculations using arithmetic and logical functions
- Working with text functions for data manipulation
- Utilizing statistical functions for data summarization
- Applying lookup and reference functions for data mapping
Session 3: Data Analysis with PivotTables and Charts
- Introduction to PivotTables and their role in data analysis
- Creating pivot tables to summarize and analyze data
- Using PivotTable slicers and filters for data exploration
- Visualizing data with Excel charts and graphs
- Customizing charts for effective data representation
Session 4: Advanced Data Analysis Techniques
- Applying conditional formatting to highlight data patterns
- Using data validation for data integrity and consistency
- Working with advanced filtering and sorting techniques
- Utilizing Excel’s database functions for data analysis
- Introduction to What-If analysis and Goal-Seeking
Session 5: Data Visualization and Automation
- Creating advanced charts and graphs for data visualization and excel dashboards
- Automating repetitive tasks using Excel macros
Workshop Packages: Microsoft Office suite, Reading Materials, Session videos, after training services, before training services

Reviews
There are no reviews yet.