Course Description: This workshop training is designed for individuals who want to acquire essential skills in data visualization and business intelligence using Microsoft Power BI. Participants will learn how to import, transform, clean, analyze, and visualize data to make informed business decisions.
Course Duration: 2 weeks
Prerequisites:
- Basic computer skills
- Familiarity with Microsoft Office applications
- Has Zoom video conferencing tool
- Willing to learn business analytics
Course Objectives
At the end of the workshop training participants will be able to:
- Connect data to the software.
- Transform and clean data to create a data model.
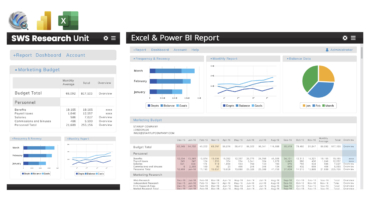
- Create visuals, such as charts or graphs that provide visual representations of the data.
- Create reports that are collections of visuals on one or more report pages.
- Share reports with others by using the Power BI service.
Course Outline:
Session 1: Introduction to Power BI
- Understanding the role of Power BI in data analytics and visualization
- Exploring the Power BI ecosystem and its key components
- Installing and setting up Power BI Desktop and Power BI Service
- Navigating the Power BI interface and getting familiar with its features
- Importing data from various sources into Power BI
Session 2: Data Transformation and Modeling in Power BI
- Using Power Query Editor for data transformation and cleaning
- Applying data filtering, splitting, merging, and formatting operations
- Handling missing data and data quality issues
- Combining multiple data sources using relationships
Session 3: Data Visualization and Dashboard Creation in Power BI
- Design principles for effective Power BI dashboards
- Building a comprehensive dashboard in Power BI
- Understanding data visualization principles and best practices
- Creating interactive charts, graphs, and tables
- Formatting and customizing visual elements
- Using slicers and filters for interactive data exploration
- Enhancing visualizations with conditional formatting and drill-through actions
Session 4: Introduction to DAX (Data Analysis Expressions)
- Understanding the basics of DAX and its role in Power BI
- Creating calculated columns and measures using DAX functions
- Aggregating and summarizing data with DAX
- Working with time intelligence functions
- Solving common business problems with DAX expressions
Session 5: Business Decision-Making and Presentation
- Interpreting analytics results for business insights
- Communicating findings effectively to stakeholders
- Case studies and real-world applications of Excel and Power BI in business analytics
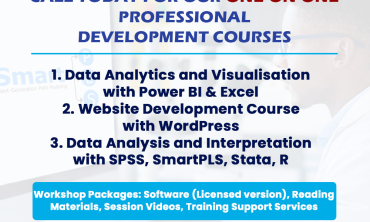
Workshop Packages: Microsoft Power BI, Reading Materials, Session videos, after training services, before training services

Reviews
There are no reviews yet.